ions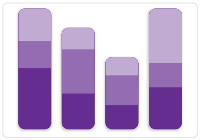
Use this chart to...
- Review your backlog and understand the distribution of work - by time (Iteration/release) or area path
- Identify where work is in the wrong iteration or area path
- Show stakeholders where the effort has gone / will be going
What the chart shows...
- The stacked columns show the number of work items in each state on the board.
- Filter by state to focus on specific work - for example, to show the completed work to a stakeholder
- Work items may be displayed by Iteration path
 or by Area path
- Clicking on a bar to obtain the list of work items in a specific state.
- You may find the Backlog Map useful as an alternative view


Setting up the chart
- Select the Project and Team
- Beginning typing in the
...
- box and select from the generated list to add
...
- Labels
- Choose the
...
- Versions, Sprints and Components from the drop-down menu
- Select
...
- Issue type
- Enter a name to save the chart
- Click load to render the chart
