Skip to end of metadata
Go to start of metadata
You are viewing an old version of this page. View the current version.
Compare with Current
View Page History
« Previous
Version 3
Next »

Use this chart to...
- Indicate how far down the backlog a team will get by a specified date.
- Focus stakeholders' attention on the range of functionality between the probable scope and the possible scope lines.
What the chart shows...
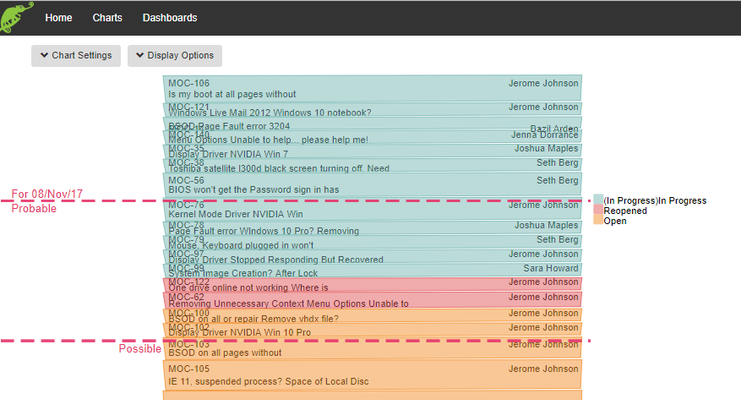
- The range of functionality that is likely to be delivered by a date that is specified in the chart settings
- This can be either a specific date or a set x weeks in the future
- Using the historical completion rate (velocity) of the team it is possible to give two key lines
- The probable scope, which is similar to using the pessimistic line in the burn-up chart
- The possible scope, based on the optimistic line in the burn-up
- Using a range like this is a) more truthful and b) better at engaging stakeholders in the necessary (ongoing) discussion about priorities in the backlog


0 Comments