Purpose: To engage stakeholders in the backlog by making it more comprehensible and providing them with a business perspective that they recognise
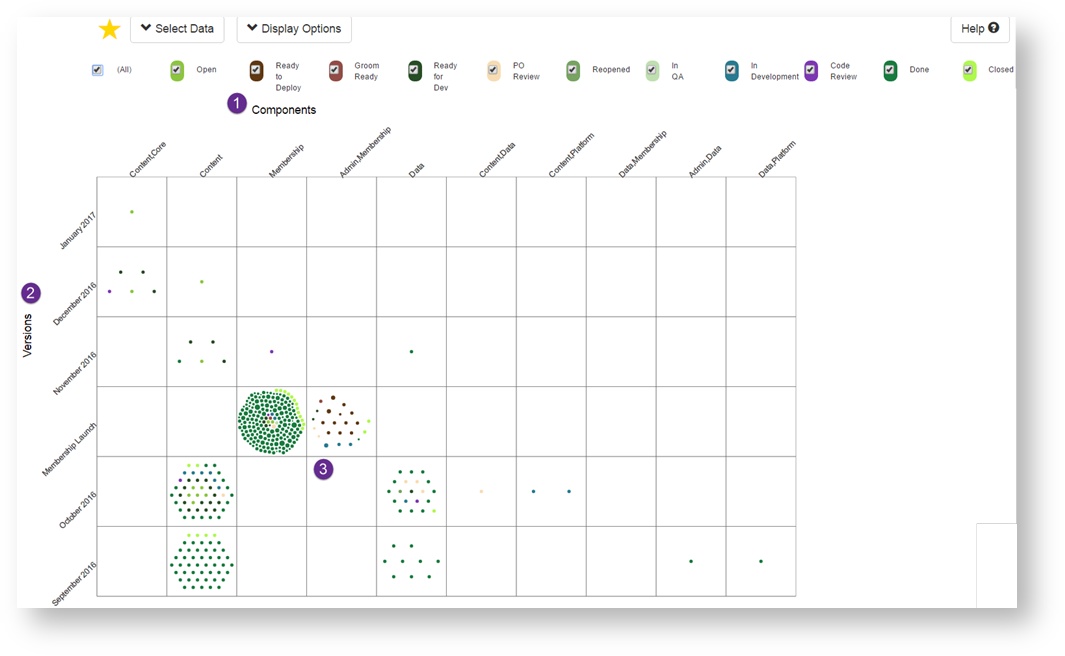
This shows the backlog with the 'Business dimension' (Components or Labels) along the top and the Time dimension (Versions ) down the left hand side.
Stakeholders can see where the effort went during October and just how many issues were completed for the Membership Launch.
The X axis can be toggled between labels or components
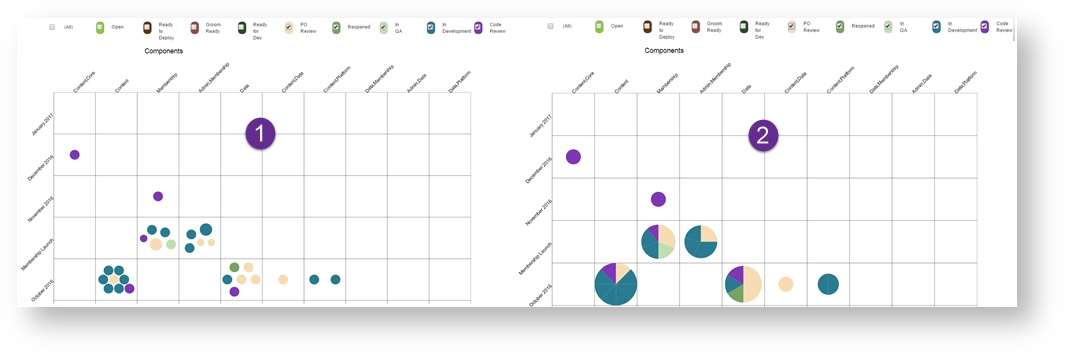
The user can toggle between seeing the location of every item on the backlog or by representing them as Pie Charts.
This helps stakeholders see the where the team's effort is focused.
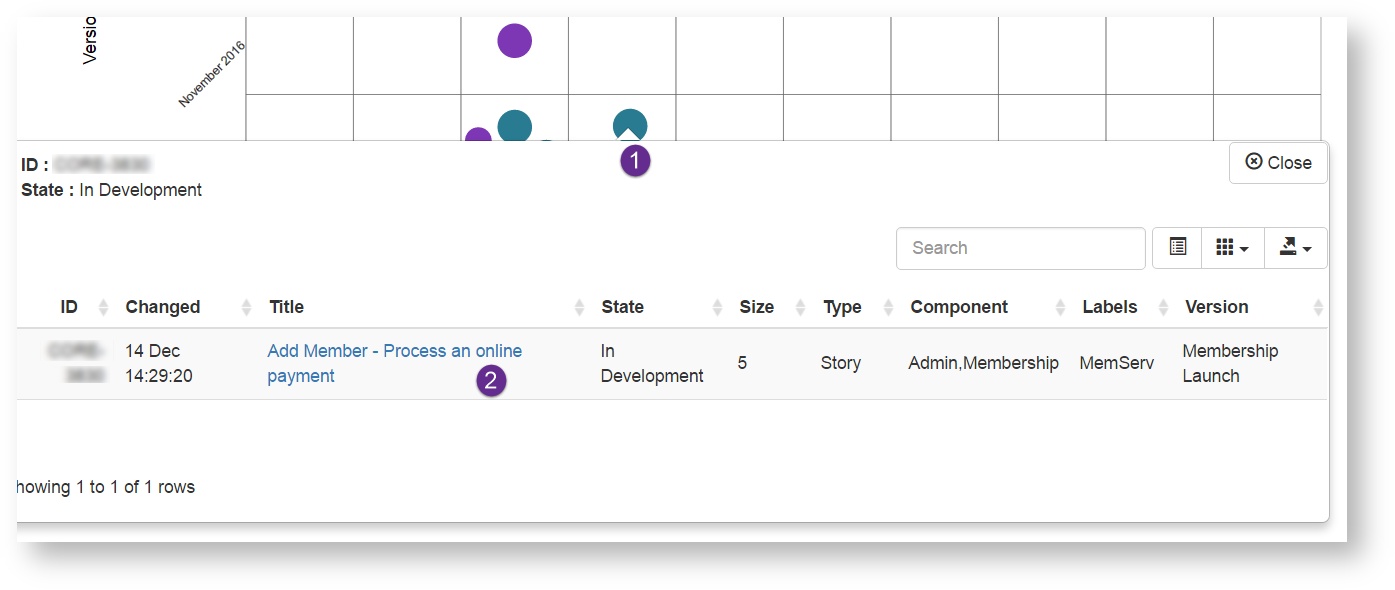
Clicking on a bubble enables you to open the issue in JIRA


0 Comments