...
More information on the burn-up
Selecting the data
| Field | Description |
|---|---|
| Project | Select the project from the drop down list |
| Board | Select the board from the drop down list |
| Labels | Begin entering text and select from the list of labels generated. Multiple labels may be added and/or deleted |
| Versions | Select version(s) using the check boxes to select specific versions or select All |
| Sprints | Select sprint(s) in the same way |
| Components | Select component(s) |
| Mode 2 Filter | 'Mode 2 History' - enables you to adjust the query to return issues that have only recently been labelled or moved into a version (see below for more details) |
| Date selection | You can choose either a range - e.g. the last 12 weeks. Alternatively you can choose a fixed start date with either a fixed end date or with a rolling end date that is always 'today' |
| Issue Types | Select which issue types you want returned |
| Add Filter | Use the slider to include or exclude selected Epics. Begin entering text and select from the list of generated Epics. |
| Save | Enter a name before saving |
| Load | Hit 'Load' to get the data for your chart |
...
| Field | Description | ||
|---|---|---|---|
| Data interval | Select the frequency you want to sample the historical data - in days. | Date range | Choose the start date of the chart. The end date will default to 'today' and roll forwards - unless you fix it with a specific date. |
| Done States | Decide which states represent 'Done' for your team. This will be used to work out the lower red throughput line. | ||
| Manual Throughput | You may want to override the calculated historical throughput rate e.g. in the early stages of a project, before the team's throughput has stabilised. You can enter a value here of the number of effort points the team is expected to finish per interval (as set above). | ||
| Manual Range | Use this to set the spread of the forecast optimistic and pessimistic lines (if you have used the manual throughput rate). You can set the Standard Deviation manually, e.g. if you don't yet have enough history to calculate the SD. This number will then be used to draw the optimistic and pessimistic forecast lines. | ||
| Estimated Size | The chart calculates average item size based on history and uses this for all unestimated items. You can override this with an estimated size. | ||
| Hide and apply chart settings | This will do a reload based on your new chart settings - and then hide the data selection panel. | ||
| Hide settings | Hides the panel without reloading the data. |
...
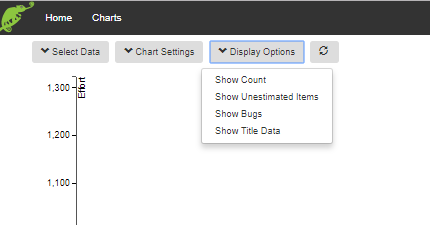
| Show Count/Effort | Toggles between showing the Count of the number of items or the total Effort - on the Y axis. |
| Show/Hide unestimated items | Toggles between showing/hiding the number of unestimated items in the backlog. |
| Show/Hide bugs | Toggles between showing/hiding the number of bugs in the scope backlog. |
| Hide Title data | Hides the table that summarises which settings were selected in the creating of the chart. |
| Data x days old - refresh | In order to speed up this chart we cache the last saved version of it. This could have been several days earlier. Click this button to refresh the data in the chart. |
Anchor
Mode 2 History
The 'history adjustment' filter enables you to decide on how you want to account for the history of items that currently meet, or have ever met, the search criteria.
...
