BurnUp
- Bazil Arden (Unlicensed)
- Jo Haley (Unlicensed)
Use this chart to...
- Provide stakeholders with a realistic prediction of when they can expect delivery of a release or project.
- Show that there are two key variables that determine the ‘Landing Zone’ for a project; The Scope and the Completion rate (aka velocity).
Engage the business by showing them that they have influence over the completion dates by adjusting scope.
The chart is so clear that many clients use it to report up to the highest level stakeholders in the organisation.
Protect the team from unrealistic expectations of what is possible.
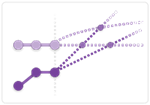
What the chart shows...
- Historical rates of completion of work and the increase in scope.
- The likely increases in completed work and scope - these cross-over to form 'the Landing Zone'.
- From experience, the rate at which Scope continues to grow surprises most teams and stakeholders.
More information on the burn-up

Selecting the data
| Field | Description |
|---|---|
| Project | Select the project from the drop down list |
| Board | Select the board from the drop down list |
| Labels | Begin entering text and select from the list of labels generated. Multiple labels may be added and/or deleted |
| Versions | Select version(s) using the check boxes to select specific versions or select All |
| Sprints | Select sprint(s) in the same way |
| Components | Select component(s) |
| Mode 2 Filter | 'Mode 2 History' - enables you to adjust the query to return issues that have only recently been labelled or moved into a version (see below for more details) |
| Date selection | You can choose either a range - e.g. the last 12 weeks. Alternatively you can choose a fixed start date with either a fixed end date or with a rolling end date that is always 'today' |
| Issue Types | Select which issue types you want returned |
| Add Filter | Use the slider to include or exclude selected Epics. Begin entering text and select from the list of generated Epics. |
| Save | Enter a name before saving |
| Load | Hit 'Load' to get the data for your chart |
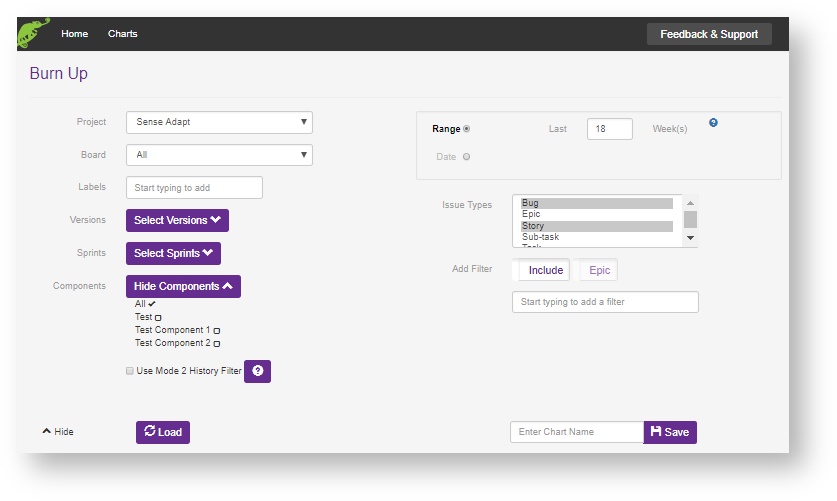
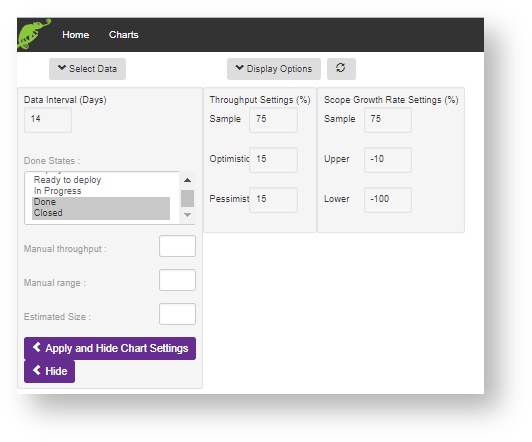
Chart Settings
Having loaded the data you can refine some of the key parameters of the chart. All of these settings are saved with the chart and therefore only need to be done once for a project or release.
| Field | Description |
|---|---|
| Data interval | Select the frequency you want to sample the historical data - in days. |
| Done States | Decide which states represent 'Done' for your team. This will be used to work out the lower red throughput line. |
| Manual Throughput | You may want to override the calculated historical throughput rate e.g. in the early stages of a project, before the team's throughput has stabilised. You can enter a value here of the number of effort points the team is expected to finish per interval (as set above). |
| Manual Range | Use this to set the spread of the forecast optimistic and pessimistic lines (if you have used the manual throughput rate). You can set the Standard Deviation manually, e.g. if you don't yet have enough history to calculate the SD. This number will then be used to draw the optimistic and pessimistic forecast lines. |
| Estimated Size | The chart calculates average item size based on history and uses this for all unestimated items. You can override this with an estimated size. |
| Hide and apply chart settings | This will do a reload based on your new chart settings - and then hide the data selection panel. |
| Hide settings | Hides the panel without reloading the data. |
| Field | Description | |
|---|---|---|
| Throughput Settings | ||
| Sample | Choose how much of the project history you want to include to calculate the mean throughput rate (velocity) '75%' will use the last 75% of sample interval velocities to calculate the mean. | |
| Optimistic | Optimistic will calculate the higher throughput rate, as a standard deviation from the mean. '15' will provide 0.15 standard deviations from the mean | |
| Pessimistic | Pessimistic will provide the lower throughput rate, also using standard deviations from the mean. | |
| Scope Growth settings | ||
| Sample | Choose how much of the project history you want to include to calculate the mean Scope growth rate '75%' will use the last 75% of sample interval velocities to calculate the mean. | |
| Upper | Determines the rate at which the rate of scope growth slows down. So, '10%' means that for each interval (set above), the rate of growth is reduced by 10%. The same is applied to subsequent intervals, until the rate of growth is 0%. | |
| Lower | As above - however this determines the lower scope forecast. If this is set to 100% then it gives a straight line. | |
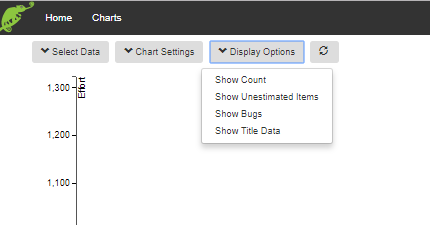
Display Options
These are not saved to the database but are personal formatting preferences.
| Show Count/Effort | Toggles between showing the Count of the number of items or the total Effort - on the Y axis. |
| Show/Hide unestimated items | Toggles between showing/hiding the number of unestimated items in the backlog. |
| Show/Hide bugs | Toggles between showing/hiding the number of bugs in the scope backlog. |
| Hide Title data | Hides the table that summarises which settings were selected in the creating of the chart. |
| Data x days old - refresh | In order to speed up this chart we cache the last saved version of it. This could have been several days earlier. Click this button to refresh the data in the chart. |
Mode 2 History
The 'history adjustment' filter enables you to decide on how you want to account for the history of items that currently meet, or have ever met, the search criteria.
This filter applies to: Components, Labels and Versions.
Mode 1 (default) - Items that meet the current search criteria on particular dates through the project's history.
Example:
In this case we show items in history that meet the 'current selection criteria'. So if they match the search criteria at each individual historical interval date. e.g. if you selected 'Label A' then it will show for previous dates in history the items that match 'Label A' on those dates.
Mode 2 - as mode 1 but in addition we assume that an item has always met those criteria throughout its existence prior to the most recent date that it matches the selection criteria. i.e. an issue that has recently linked to 'Label A', but was not previously 'Label A' - this will show the history of the issue before it was linked to 'Label A'
Warning: You may end up hiding some of the historical movements of Items when using this filter