Table of Contents
Use this chart to...
- Visualise the behaviour of the overall system over time.
- Highlight the location of queues or bottlenecks in the system as well as highlighting where there is too much work in progress (WIP).
...
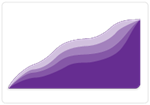
Table of Contents
...