Stuck Work
- Bazil Arden (Unlicensed)
- Jo Haley (Unlicensed)
Use this chart to...
- Raise team's awareness of work that they may have overlooked or has become stuck in a column on the board.
What the chart shows...
- How long (in days) that an item has been in a given state.
- Items that have been in that state for longer than the previous 30 day median. Click on a column in the chart to see the item and open it up in edit mode.
Select data
Select the project, version(s) and component(s). Decide which Issue types you want to include - and click load.
If you want to keep the chart, in order to share with others, give it a name and save it.
Display options
You can toggle the chart parameter data on or off - this can be useful if you need to take a screen-grab for a presentation.
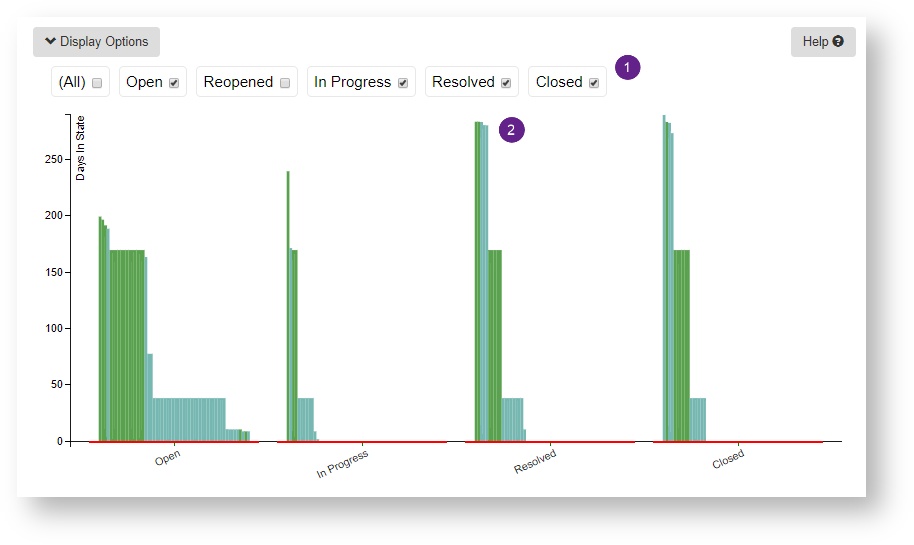
Select which states ![]() you want to see the data for.
you want to see the data for.
Each column represents an issue with the height ![]() being the number of days in that state. The colour shows whether it is a story, a bug or a blocked story/bug.
being the number of days in that state. The colour shows whether it is a story, a bug or a blocked story/bug.
The red line shows the mean time that issues have been taking to get across that state in the previous 30 working days.
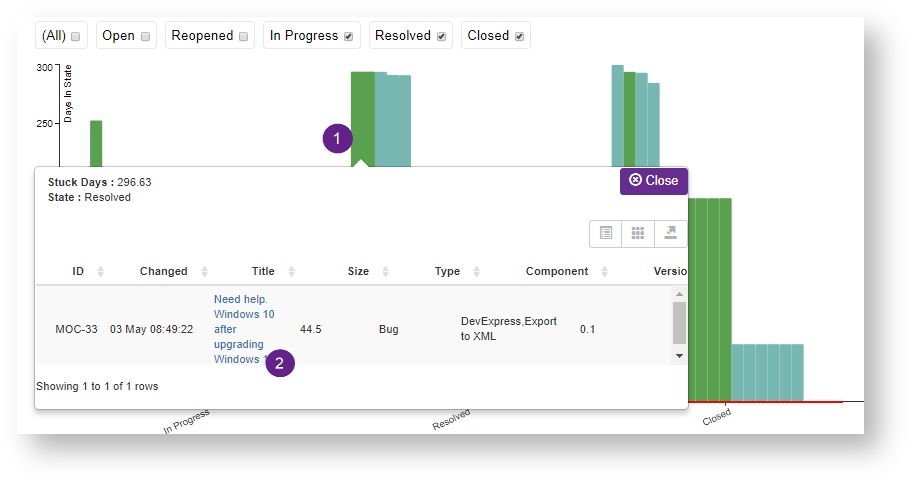
Clicking on the bar ![]() shows the details of the item and enables you to click
shows the details of the item and enables you to click ![]() and open it up in JIRA.
and open it up in JIRA.