/
Estimate Accuracy
Estimate Accuracy
- Bazil Arden (Unlicensed)
- Jo Haley (Unlicensed)
Owned by Bazil Arden (Unlicensed)
Use this chart to...
- See how good your team's estimating has been and whether it's worth trying to improve it.
- Good input for retrospectives, where you can focus on some of the outliers to understand the root cause for the correlation between work item size and progression time.
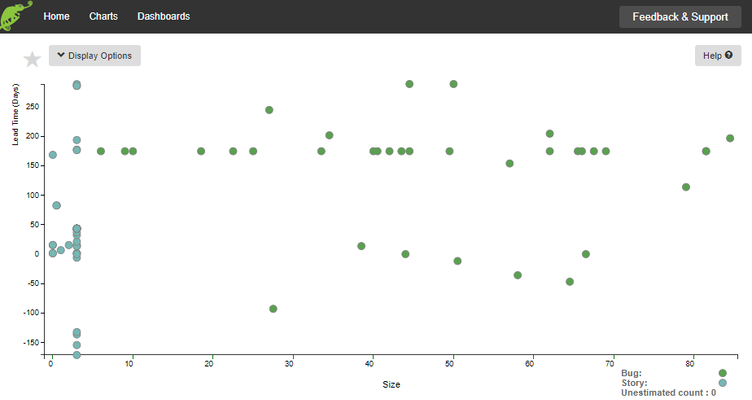
What the chart shows...
- The strength of the correlation between work item size (typically measured in story points) and the time it takes to go across the selected number of 'In Progress' states.
- Where 1 means there is a very strong correlation and 0 means no correlation.
- Hover over the blob to see details of the item cycle time - click through to open the item.
- Issues and bugs are shown in different colours.
Setting up the chart
- Decide on which issue types to track
 . Probably the user stories as most teams don't estimate bugs.
 - Select the states which represent 'In Progress'
 .
.
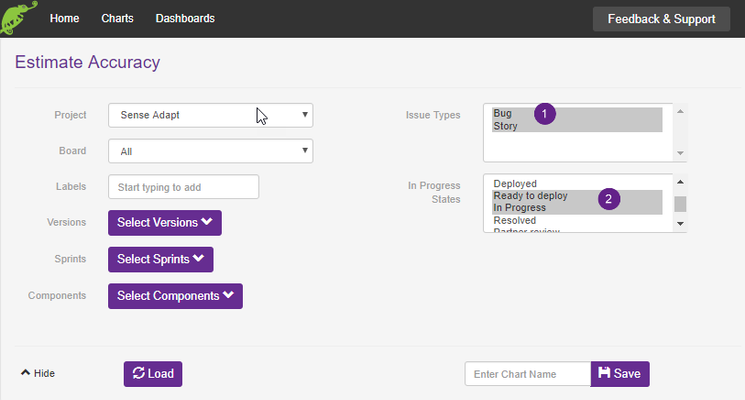
Selecting the data
Field | Description |
|---|---|
| Project | Select the project from the drop down list |
| Labels | Begin entering text and select from the list of labels generated. Multiple labels may be added and/or deleted |
| Versions | Select version(s) using the check boxes to select specific versions or select All |
| Sprints | Select sprint(s) in the same way |
| Components | Select component(s) |
| Issue Types | Select which issue types you want returned |
| In progress states | Select the states you consider as being 'in progress' |
| Load | Hit 'Load' to get the data for your chart |
| Save | Enter a name before saving |
, multiple selections available,
Related content
BurnUp
BurnUp
More like this
Potentially Deliverable Scope
Potentially Deliverable Scope
More like this
Treemap
Treemap
More like this
Backlog health
Backlog health
More like this
BurnUp
BurnUp
More like this
Requirements Readiness
Requirements Readiness
More like this