/
Requirements Readiness
Requirements Readiness
- Bazil Arden (Unlicensed)
- Jo Haley (Unlicensed)
Owned by Bazil Arden (Unlicensed)

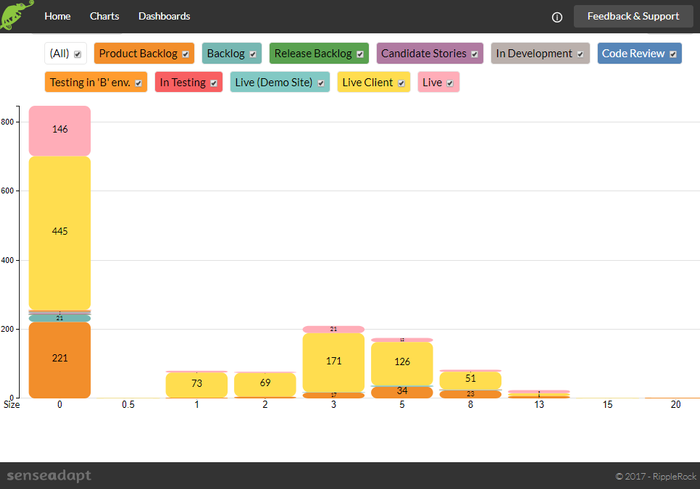
Use this chart to...
- Help the team focus on the requirements that need to be sliced smaller to get them ready for development
- Review work to see the distribution of sizes of work that have been done or are still in the backlog.
- For example to see what proportion of completed work is say a 3 or a 5 (if using story points)
- If you have a 'definition of ready' which includes the size of work, then you can see how often this rule has been broken
What the chart shows...
- The distribution of work by size (assuming that the team is using estimation technique like story points)
- For work that is in a column about to be worked on (e.g. analysis or 'candidate stories') the team can quickly see which issues are too big and need to be sliced down
Setting up the chart
- Filter the data by the current version (release) if you want to focus on identifying work to be sliced down
- Select historical versions or sprints, if you want to see the distribution of sizes that have already gone across the board - which might help in estimating effort in the remaining backlog.
, multiple selections available,
Related content
Backlog health
Backlog health
More like this
CFD
CFD
More like this
Scatterplot
Scatterplot
More like this
PowerBI Help
PowerBI Help
More like this
Treemap
Treemap
More like this
Sense Adapt
Sense Adapt
More like this