/
Feature and Epic Progress
Feature and Epic Progress
- Bazil Arden (Unlicensed)
- Jo Haley (Unlicensed)
- Alex Gooding
Owned by Bazil Arden (Unlicensed)
Use this chart to...
- Illustrate the relative progress and size of Features within a version or project.
- Engage stakeholders with an easily understood representation of the features and their level of progress.
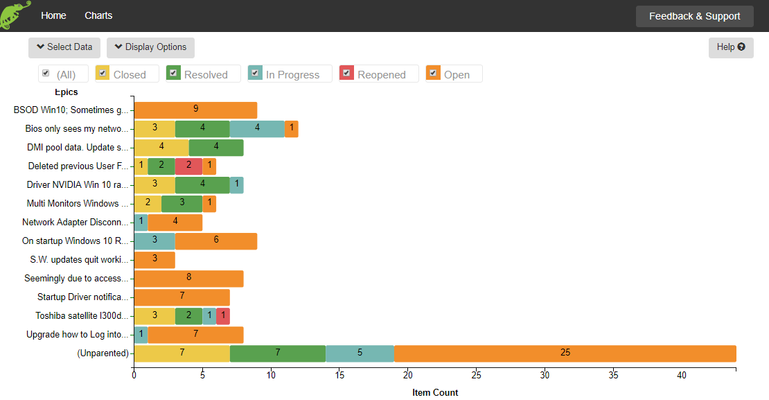
What the chart shows...
- The relative size of the features as well as their level of completeness.
- Filter by state e.g. to show which features are currently being worked on or are about to be started.
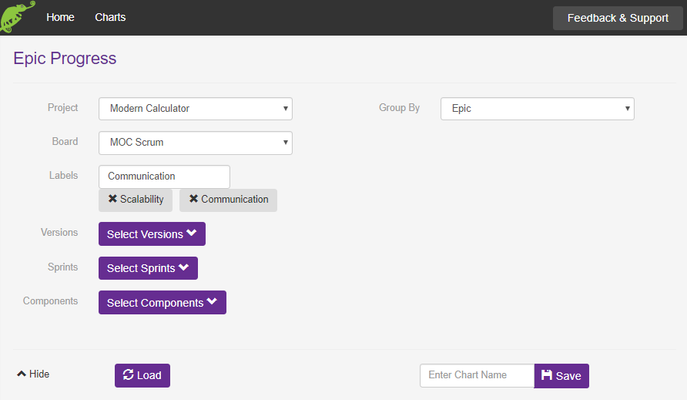
Select data
This chart is often used for an overall project view, however, you can reduce the number of Features by selecting specific versions, components or labels.
You will need to name and save the chart for future reference.
Display options
| Selection | Description |
|---|---|
| Show Count/Effort | Toggle between effort (the total of child story point sizes) or count (the number of children) |
| Hide/Show Title Data | Toggle on/off the table showing parameters used to select data for the chart |
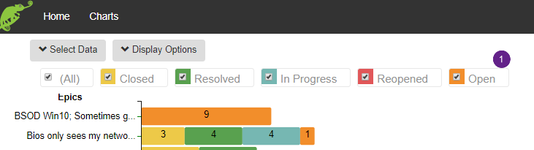
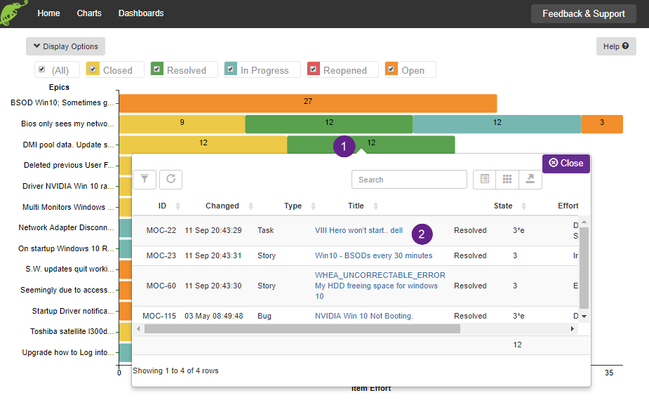
Choose the states you wish to be shown (1)
Viewing the chart
As with all the charts, you can click on an element of the chart (1) and see all the issues and bugs within the Feature. Clicking on the issue (2) will open it within JIRA.
, multiple selections available,
Related content
Treemap
Treemap
More like this
Sense Adapt
Sense Adapt
More like this
Multi-dimensional Backlog
Multi-dimensional Backlog
More like this
Backlog Map
Backlog Map
More like this
Stuck Work
Stuck Work
More like this
Backlog health
Backlog health
More like this